这是一个创建于 401 天前的主题,其中的信息可能已经有所发展或是发生改变。
1
zhengsidao 2024-03-01 09:48:32 +08:00
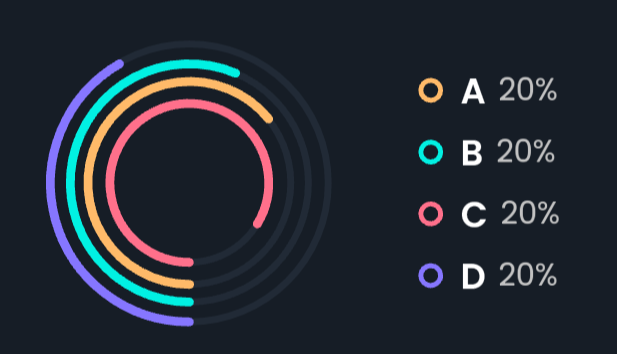
所实话不懂这个叫什么图,但是左右两边信息明显没对齐,这四个分别占比 20%,合起来也没到 100%,左边的圈圈怎么能这么显示呢?
|
2
zZWdkdGNycmbhlma 2024-03-01 09:50:10 +08:00
从 echarts 库来说这个是环形图, 控制多个环的内外径
|
3
MENGKE 2024-03-01 09:52:55 +08:00
可以直接叫 apple 圆环
|
4
ljsh093 2024-03-01 09:54:59 +08:00
这图显然数据不对啊
|
5
boluochixue 2024-03-01 09:56:56 +08:00
我去年刚做这个组件,这个类似玉珏图
|
6
x86 2024-03-01 09:57:52 +08:00 这种图一般也就做 PPT 给老头子看的,花里胡哨又没什么勾吧用
|
7
danhahaha 2024-03-01 10:03:09 +08:00
手镯子图,🐶
这图应该用比例显示吧?要不这样有什么意义? |
8
cbythe434 2024-03-01 10:53:57 +08:00
0⃣️图
|
9
RSTAR 2024-03-01 10:55:12 +08:00 就是圆饼图的变形,一般用来显示完成度百分比。
|
11
ChristopherCheng 2024-03-01 11:04:52 +08:00
@imherer 完成度直接 ABCD 四条直线进度图,是不是更直观呢,这种纯粹就是不美观也不直观。
|
12
wanguorui123 2024-03-01 11:13:19 +08:00
玉玦图
|
13
skies457 2024-03-01 11:21:16 +08:00 嵌套的 donut chart
|
14
wweerrgtc 2024-03-01 11:22:02 +08:00
内外圈的直径不一样
看起来不一样长, 实际一样长, 不知道这有什么意义 |
15
infun 2024-03-01 11:22:42 +08:00
环形柱状图
|
16
imherer OP @ChristopherCheng 是的。不过我猜这中可能占用面积更小吧
|
17
MillaMaxwell 2024-03-01 11:31:49 +08:00
@ChristopherCheng #11 忽悠忽悠老头子和不懂的人,显得高大上
|
18
Cheons 2024-03-01 11:34:32 +08:00 via Android
元素图,
XXX 大数据平台上用的到🤔 |
19
kylebing 2024-03-01 11:48:53 +08:00
明显是个作演示用的 有点像 echarts 的这个 https://echarts.apache.org/examples/zh/index.html#chart-type-sunburst
|
20
hymxm 2024-03-01 11:49:09 +08:00 智慧 xx 给大领导看的。。。
|
21
ETiV 2024-03-01 11:53:33 +08:00 via iPhone
就是“圆形的进度条”
|
22
villivateur 2024-03-01 12:59:44 +08:00 这不是 apple watch 的⚪环吗
|
23
pannanxu 2024-03-01 13:35:29 +08:00 |
24
min 2024-03-01 13:56:17 +08:00
The chart in the image you provided is known as a donut chart, which is a variant of the pie chart. It displays data in a ring rather than a circle, which can sometimes help to highlight the data more clearly. This particular donut chart seems to be equally divided into four segments, each representing 20%, which may imply that it's showing a distribution of categories or values that are evenly split across four different groups labeled A, B, C, and D.
|
25
bojackhorseman 2024-03-01 14:17:10 +08:00 |
26
sevenyangcc 2024-03-01 15:23:13 +08:00
@imherer #10 实际是柱状图变形,只表示数据长度,4 根线是长度一样,就是做 PPT 那群人搞得花里胡哨的东西,没有任何信息价值。
|
27
blackcellcode 2024-03-01 15:41:53 +08:00
对齐颗粒度的
|
28
callmesmc 2024-03-01 22:50:19 +08:00 via iPhone
就是四个饼图套在一起
|
